HOME > FINANCIAL RESULTS > 2012 Highlights
2012 Highlights
We are one of North America’s largest quick service restaurant chains, with 4,264 systemwide restaurants as at year-end 2012. Tim Hortons is one of the largest publicly-traded restaurant chains in North America based on market capitalization, and the largest in Canada by a wide measure. In Canada, we 42% share of the quick service restaurant traffic. More than 60% of our guests visit us 3 times or more every two weeks. We enjoy iconic brand status in Canada and a strong, emerging presence in select regional markets in the U.S. We are also beginning to seed international growth, and we had opened 24 restaurants in the Gulf Cooperation Council by the end of 2012.
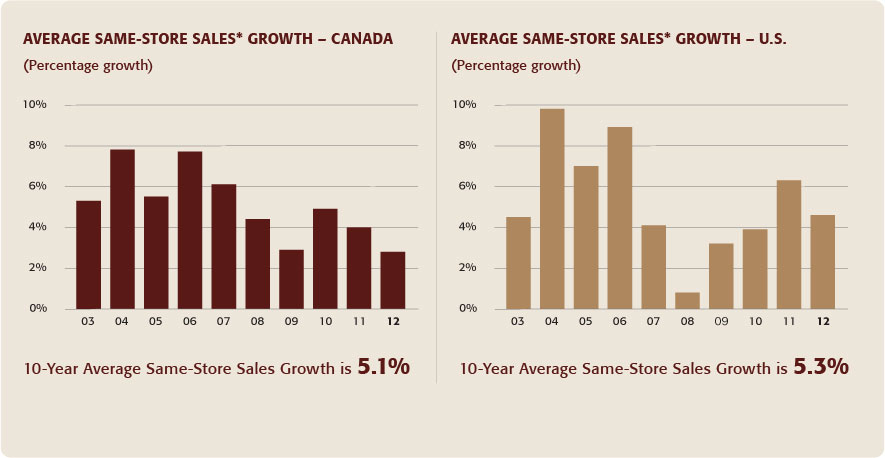
- Generated positive same-store sales growth in both the Canadian and U.S. markets for the 21st consecutive year.
- Continued to grow our system, opening 159 restaurants in Canada, 85 full-serve restaurants in the U.S. and 19 restaurants in the Gulf Cooperation Council.
- Improved the guest experience by implementing enhanced digital menu boards and free Wi-Fi connectivity at most of our restaurants across Canada.
- Broadened our guests’ payment options by accepting VISA®, VISA payWave contactless credit and Interac Flash® contactless debit cards, and select mobile credit card payments.
- Successful product launches, including Panini sandwiches and frozen lemonade in Canada, breakfast Panini sandwiches in the
U.S., and iced lattes and single-serve coffee across North America.
2012 2011 Revenues $ 3,120.5 $ 2,853.0 Operating Income $594.5 $569.5 EPS (diluted) $2.59 $2.35
Current Ratio 1.3 Quick Ratio 0.6 Total Debt to Equity Ratio 44.7%
Operating Margin18.5% Net Profit Margin12.4%